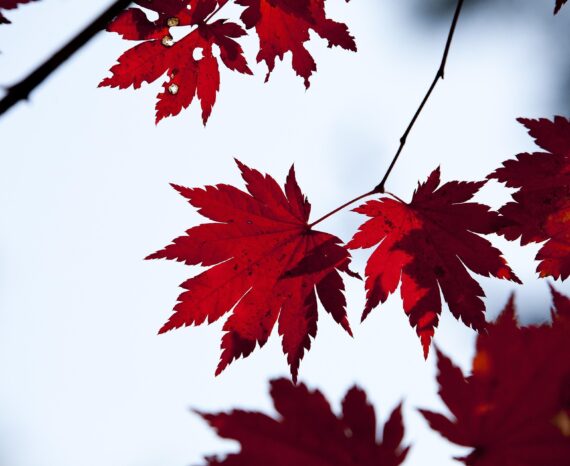
Red Maple: How Quebec’s forests are adapting to climate change
Climate change is already affecting Quebec’s forests, with expected impacts on tre …
Ms Anik Daigle, Cégep Garneau and project principal investigator
Gespe’gewa’gi Institute of Natural Understanding (GINU)
Direction principale de l’expertise sur la faune aquatique (MELCCFP)
Natural Sciences and Engineering Research Council of Canada (NSERC) Applied Research and Development (ARD) Program
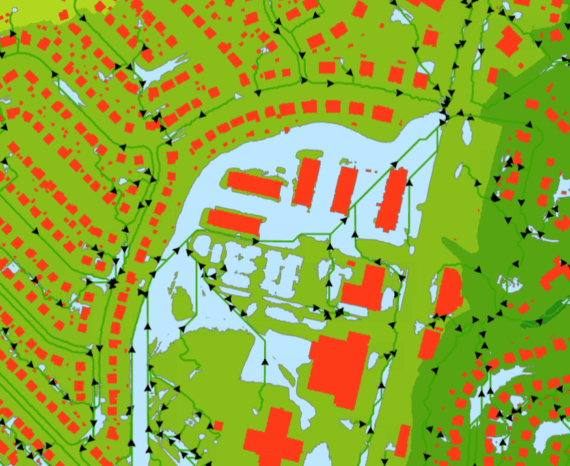
Water temperature in rivers and lakes influences water quality and aquatic habitats.
In particular, it affects dissolved oxygen levels, pollutant toxicity, the proliferation of invasive species, and the metabolism of aquatic organisms.
However, monitoring networks in Canada remain limited in both time and space. As a result, our understanding of thermal regimes remains fragmented. This complicates the assessment of water quality, aquatic habitats, ice-free and ice-covered seasons, and their impacts on spring flooding, species phenology, and fisheries. Without these data, it is difficult to anticipate the effects of global warming.
Our solution: to enhance the thermal profile of the river network in eastern Canada using satellite remote sensing.
We automatically identify “water” pixels in Landsat images. We then use this data to:
Through a user-friendly interface, users can view and download temperature time series and descriptors tailored to their needs.
2. Identification of “sentinel” pixels
We cross-reference multiple data sources to assign a probability of “water” membership to pixels.
This allows us to target only pixels that are 100% within a watercourse to avoid false measurements.
3. Longitudinal interpolation
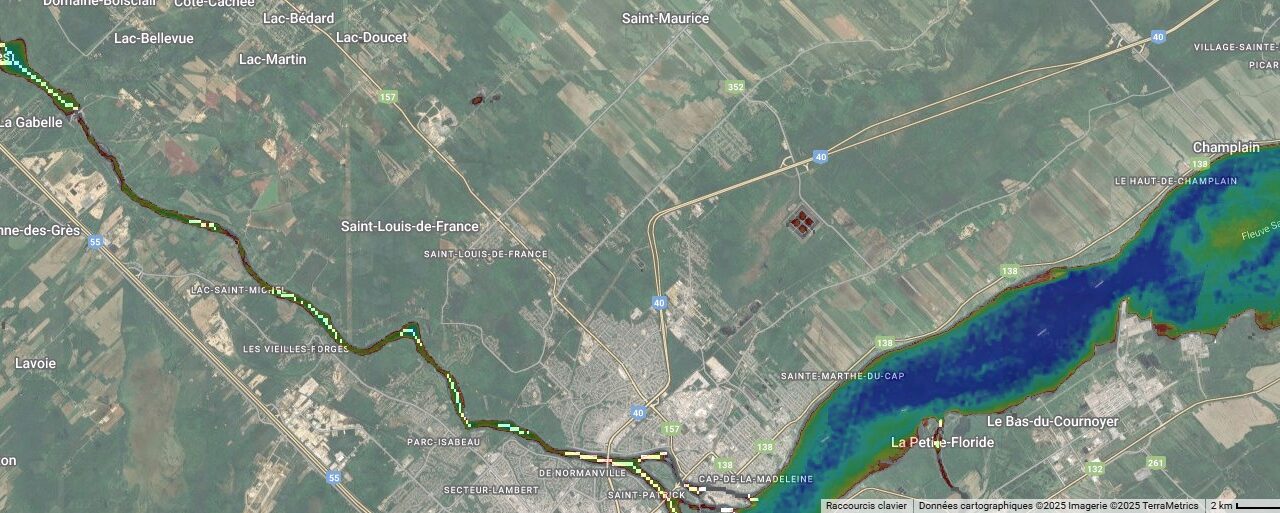
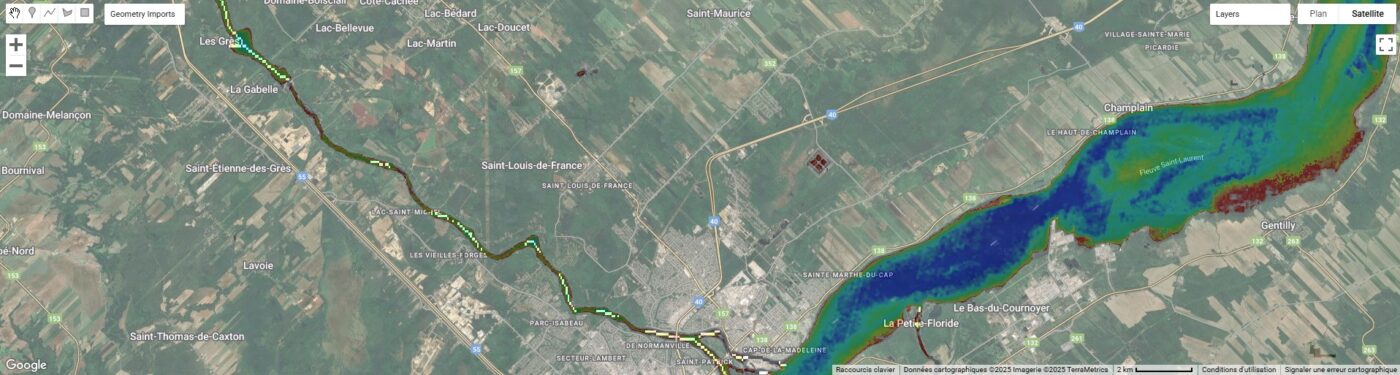
Sentinel pixels provide temperature measurements at multiple points along lakes and rivers.
Since these measurements are discrete, we perform interpolation along the longitudinal axis using:
4. Field validation
We validate the data using historical measurements from RivTemp and DataStream Atlantic. This allows us to assess the accuracy and any potential biases of the sentinel pixels.
5. Spatio-temporal characterization of thermal regimes
We extract and measure information from thermal profiles:
Setting up the distribution interface
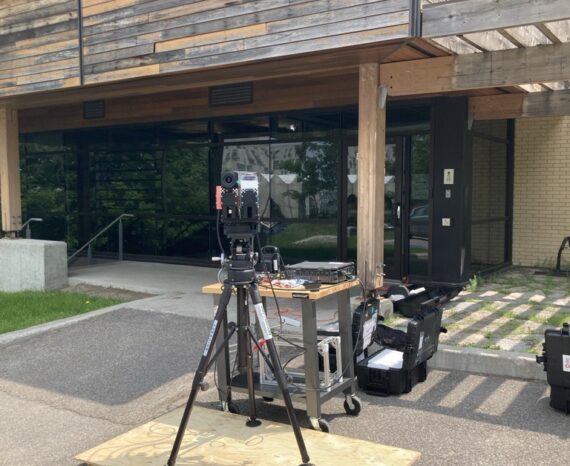
We use Google Earth Engine (GEE) to deploy an online interface.
With Apps Engine, users can:
Resource management
Environmental monitoring
Climate change is already affecting Quebec’s forests, with expected impacts on tre …
The CGQ team aims to provide CMQuébec, as well as its regional and local partners, …
This project involves conducting a campaign to acquire, process, and analyze hyper …